
2025 Census Data: Cities & Towns, 2020-2025

Earlier this month the Census Bureau’s Population Estimates Program released its 2025 population estimates for cities and towns, giving us half a decade of data since the last decennial. This followed their March release of estimates at the MSA and county level, which I posted some brief thoughts on here:

This post follows the same format as that one, giving quick high-level thoughts about what another year of change means for our region. It’s quite delayed, apologies — I’ve been on the road a ton and this month started a new job.
Quick Hit #1: Kansas City is growing robustly
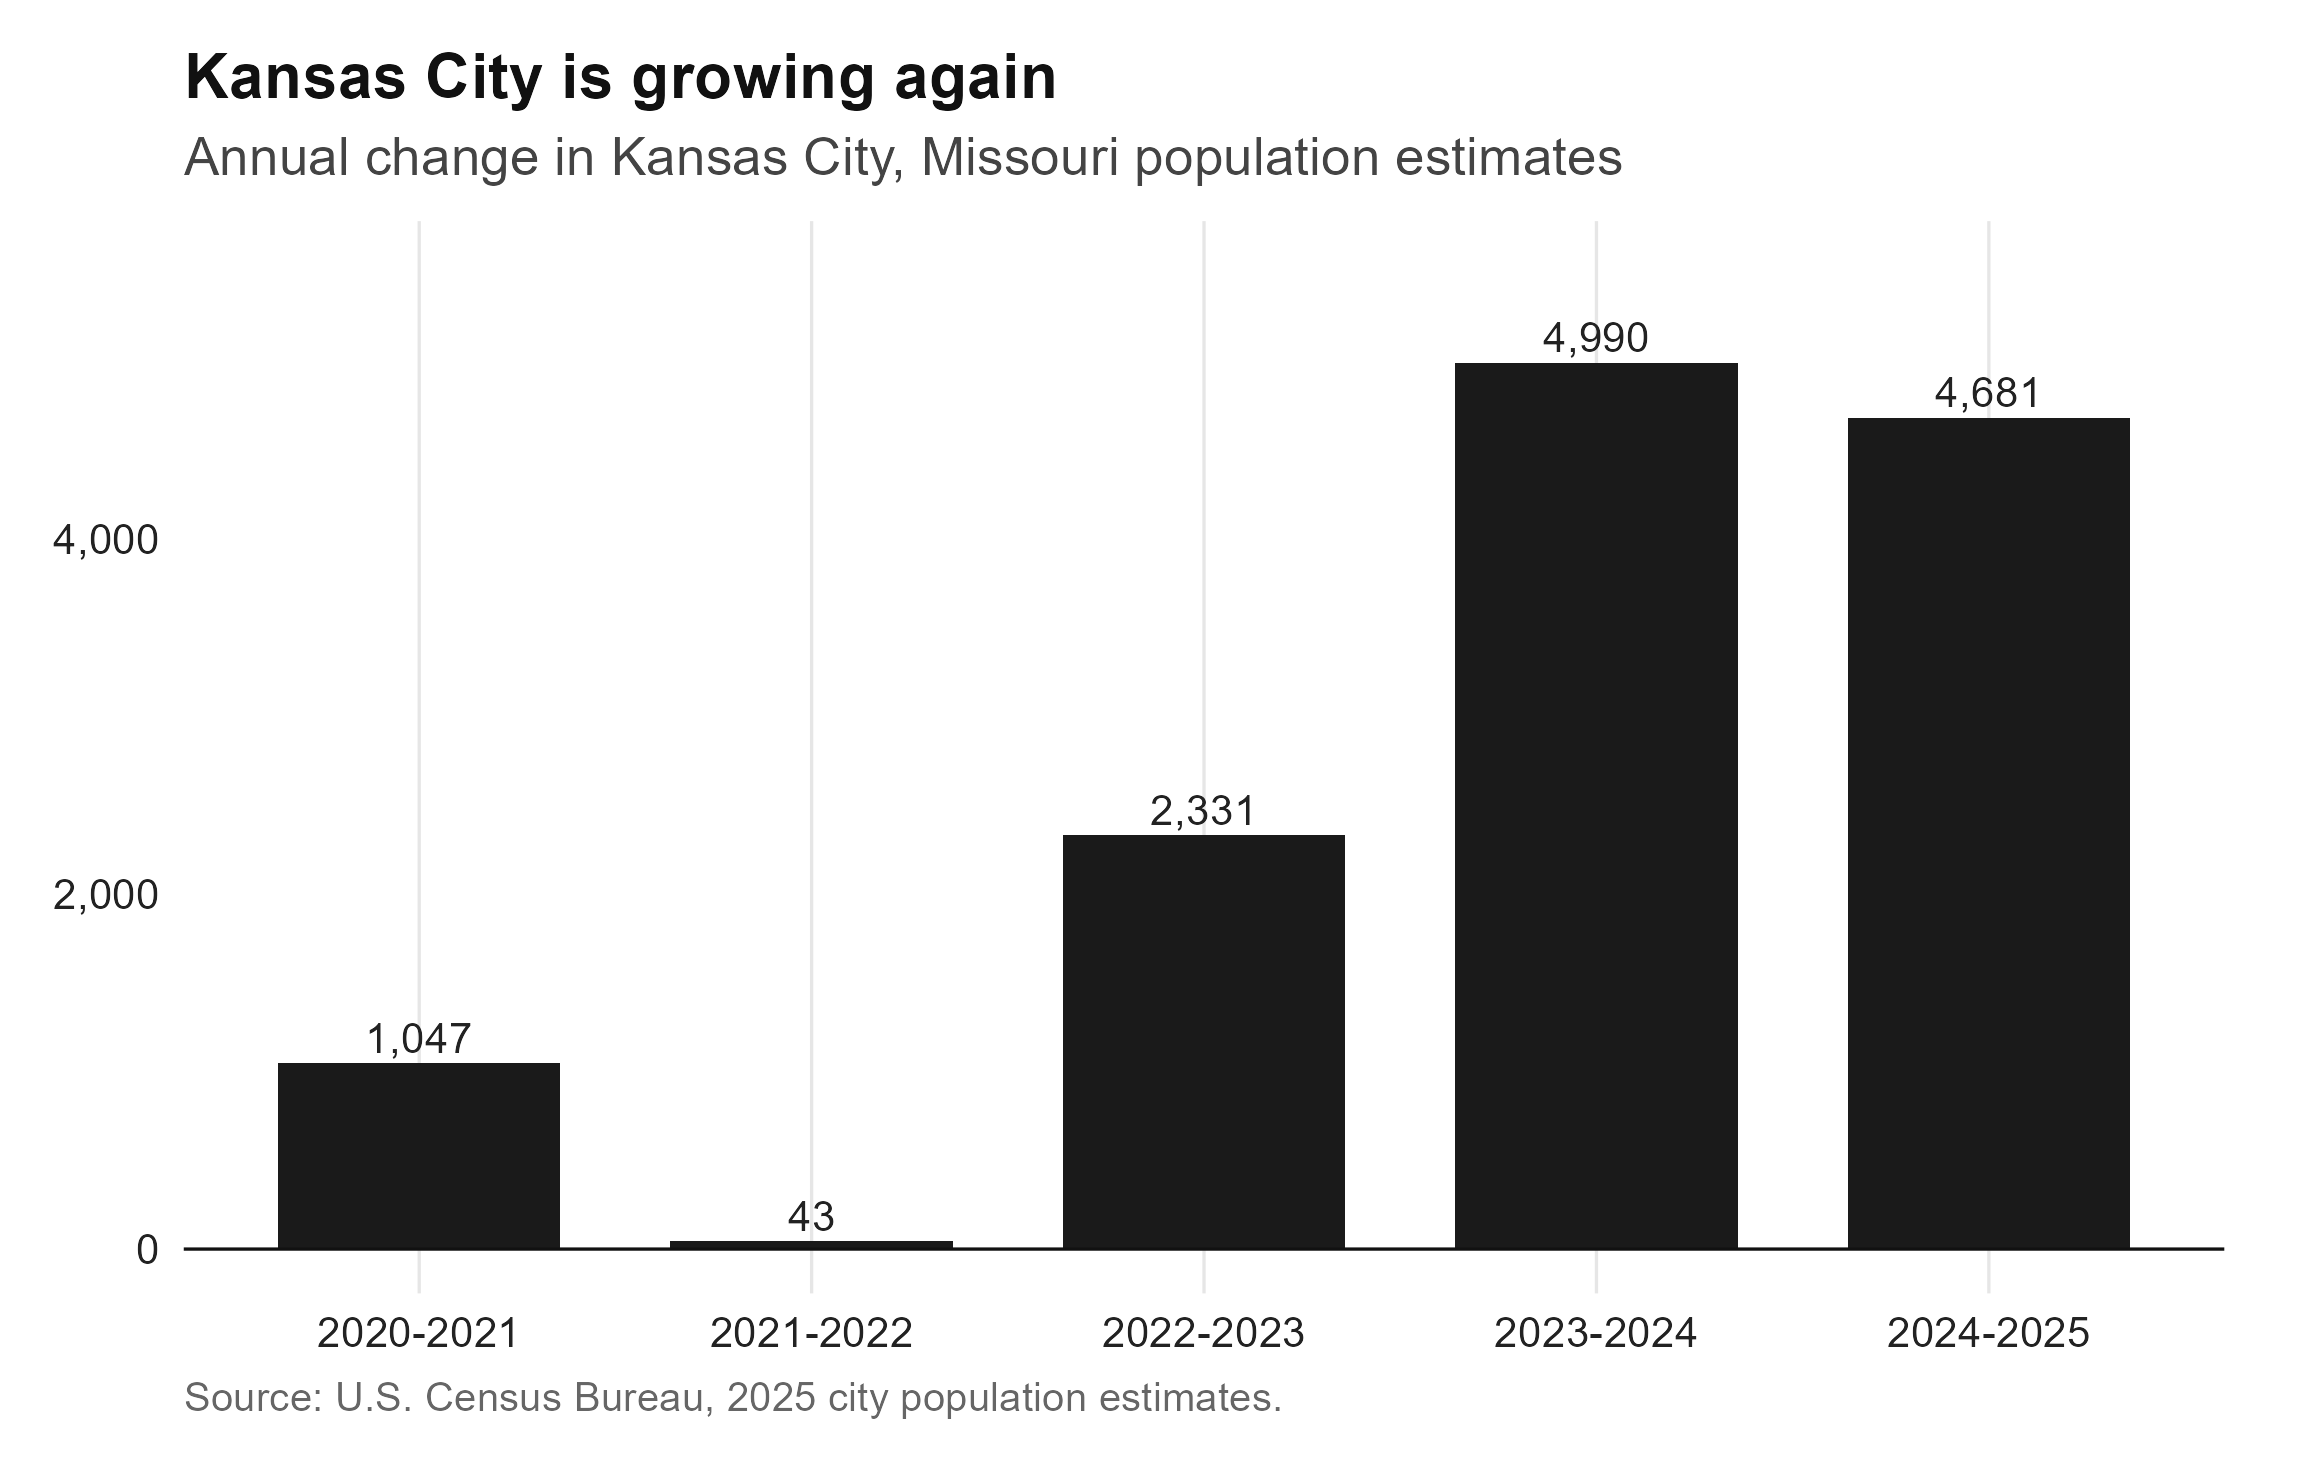
Let’s start with the headline figure: Kansas City is growing robustly again. After a slow start to the decade it added nearly 5,000 people in each of the past two years. You can arguably feel the inflow if you follow the news: there are more residential towers in the permitting or construction process now than at any point in the city’s history, the West Bottoms and Berkley Riverfront each have billion+ dollar projects underway, and a number of large Northland developments are in the early stages of coming together.
KC’s mirrors growth for the metro, which picked up over the past few years after a slow start to the decade. As I mentioned in the post on metro growth, however, we are likely to see slower growth later this decade as international migration slows. We don’t have disaggregated migration data at the city level but we know from the county data release that migration has made up more than half of JaCo’s increase in population since 2020. It’s reasonable to think that’s mirrored in the city proper.
But still, robust growth. 27% of the metro’s growth last year in a city that comprises just 23% of its population.
Quick Hit #2: …but slower than before
A 13,092 person increase since 2020 gives KC its slowest half decade of growth since 2000-2005, at just a 2.6% increase. That’s disappointing, but if we had grown at the average rate of just the past two years we would have added 4.8% to our population, a faster-than-average pace. Like all cities, KC struggled to attract and retain population during the pandemic. And as the stat at the end of the last paragraph demonstrates, the slowdown is more a result of slower metro growth than KC losing ground against its neighbors.
Still, we’re growing slower and are fairly far behind the 2010s.

Quick Hit #3: Good news for the urban core
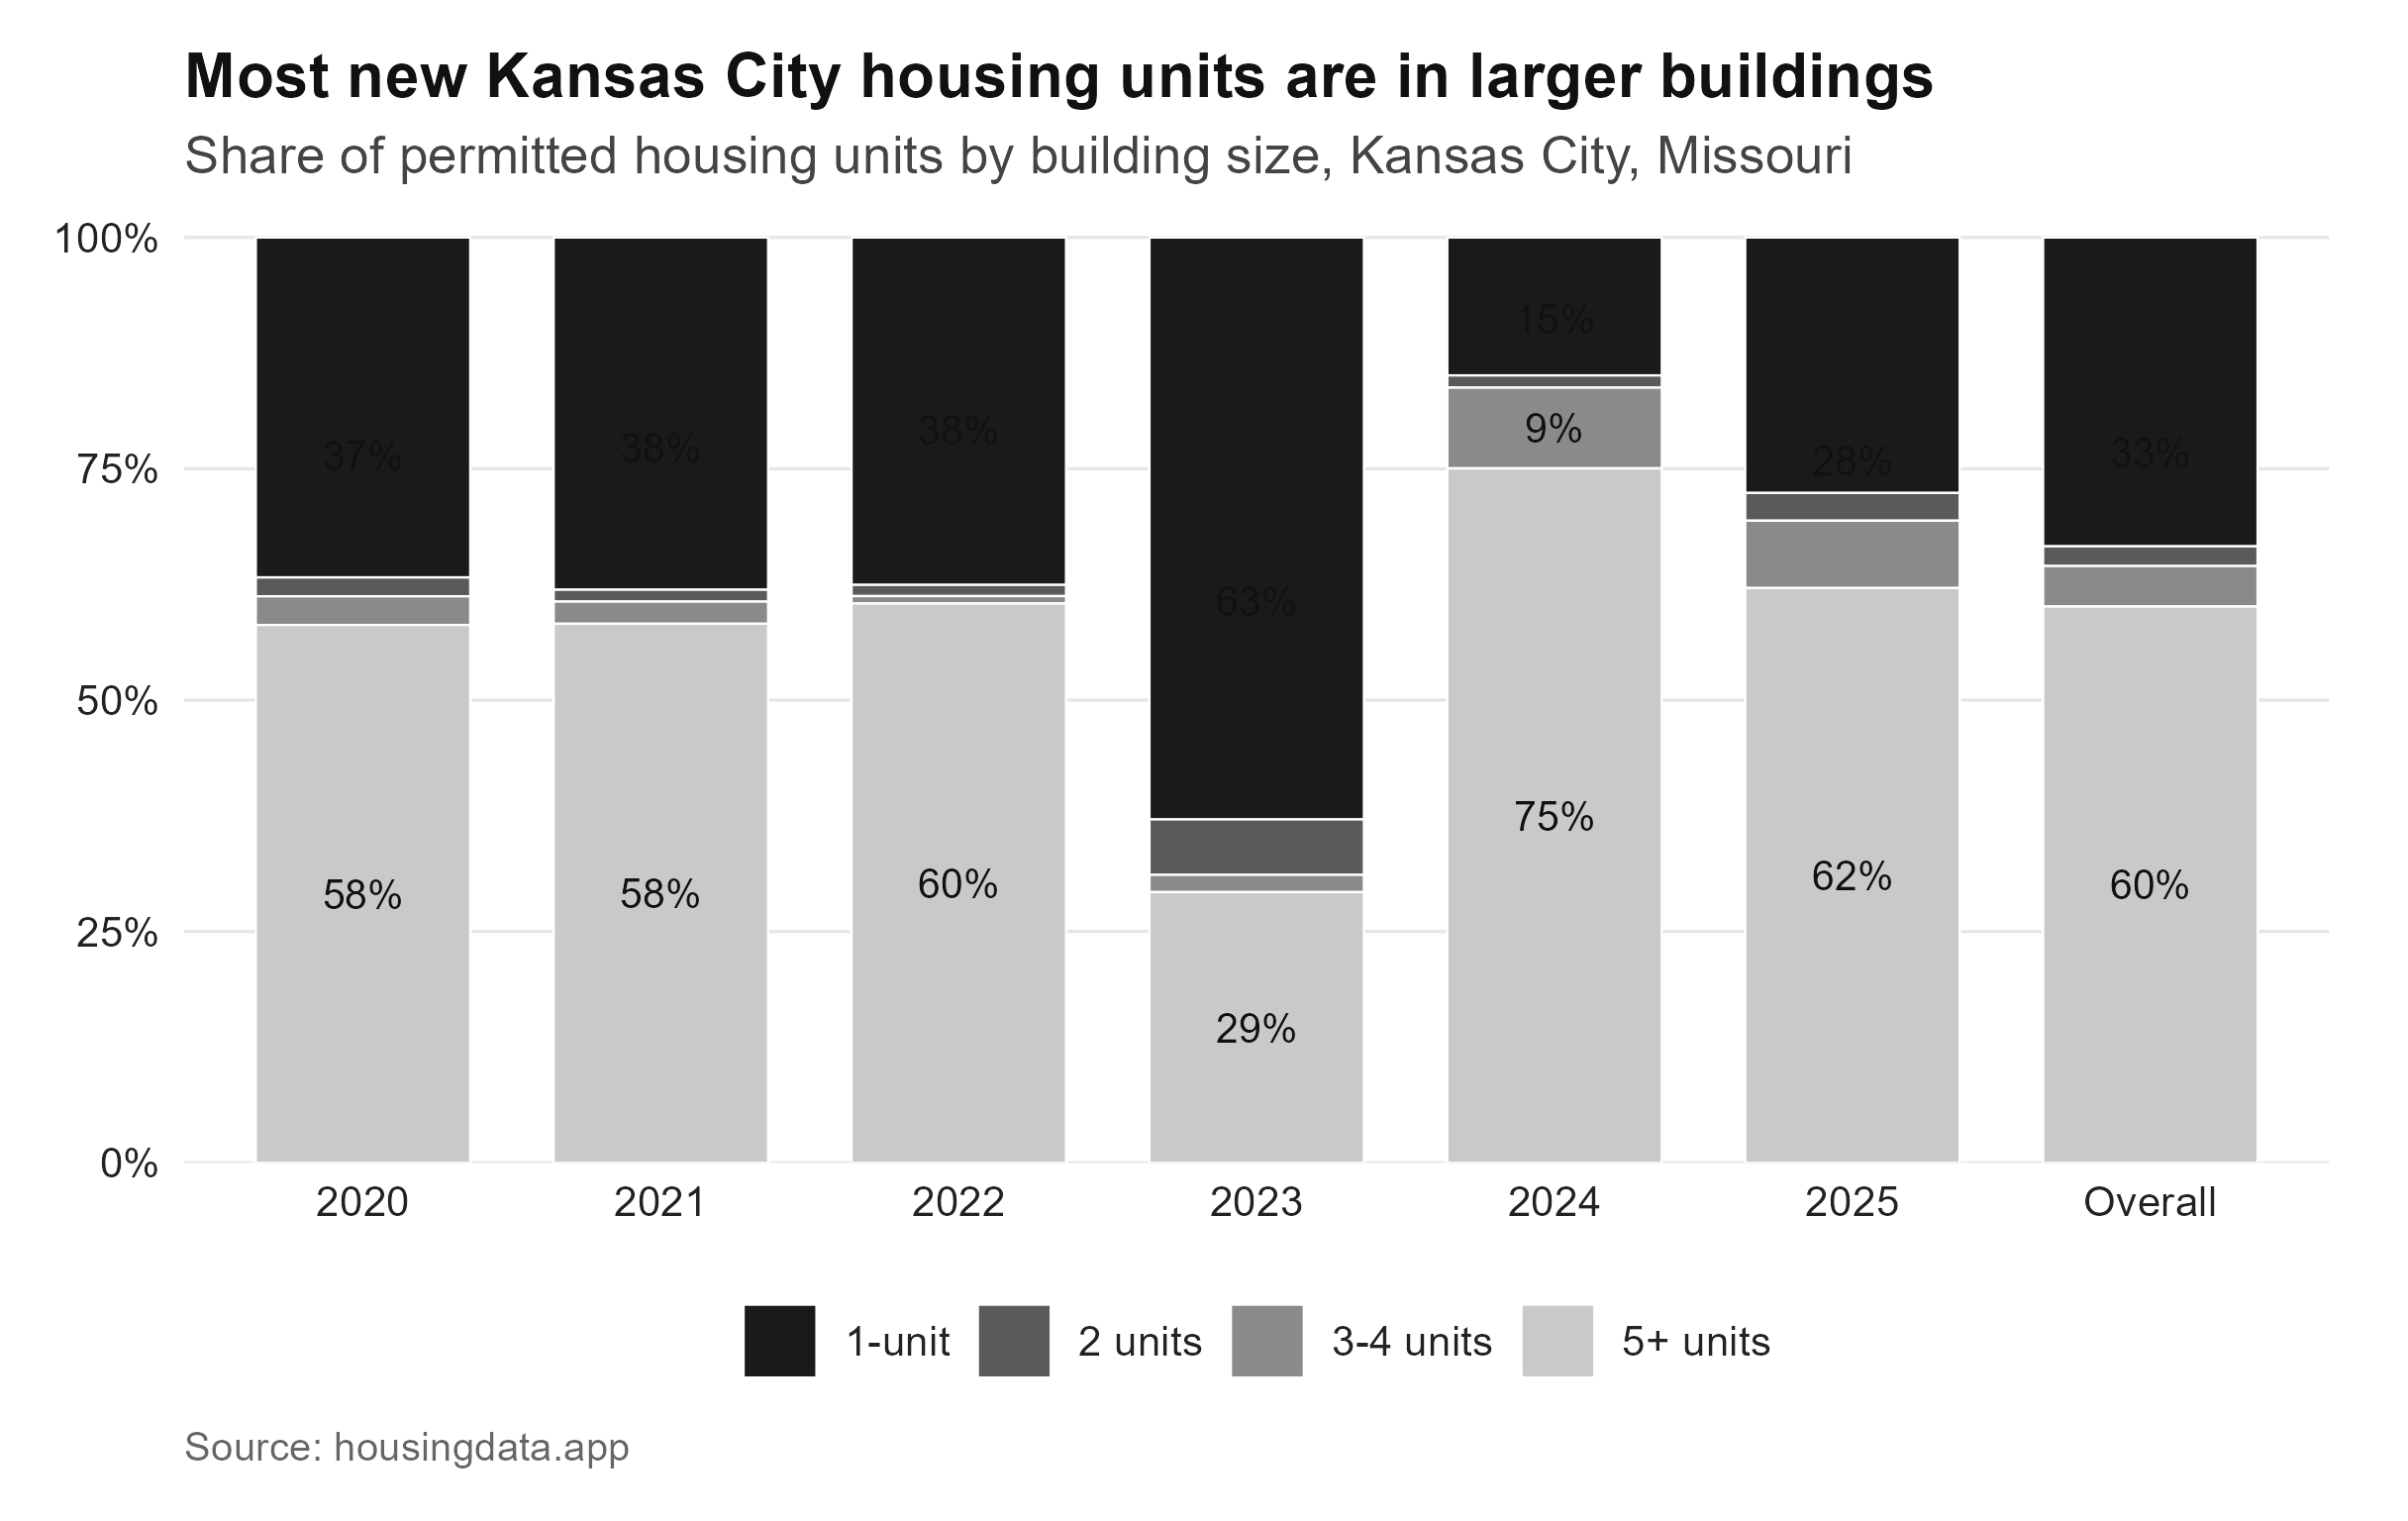
It’s hard to know where growth has happened within the city until we get richer data at the Decennial. You can get a hint from looking at housing permits though: the general KC development pattern is that single family homes are built in the Northland and multifamily happens in the historic core. There was a modest single family building boom on the east side of the core and in West Plaza up until a couple years ago but the energy code changes seem to have brought it to a halt. So looking at permits by unit count can give us a decent sense of where growth is happening.
The next chart tells the story: with the exception of 2023/2024, each year just under 2/3s of new housing permitted in the city is multifamily. Not all of that is in the historic core (there are always a couple multifamily buildings going up north of the river, and the occasional project down south of Bannister) but a large majority is. The core is almost certainly adding population, and that should continue in the coming years as several large towers begin construction and major projects finish in the West Bottoms and Berkely Riverfont.
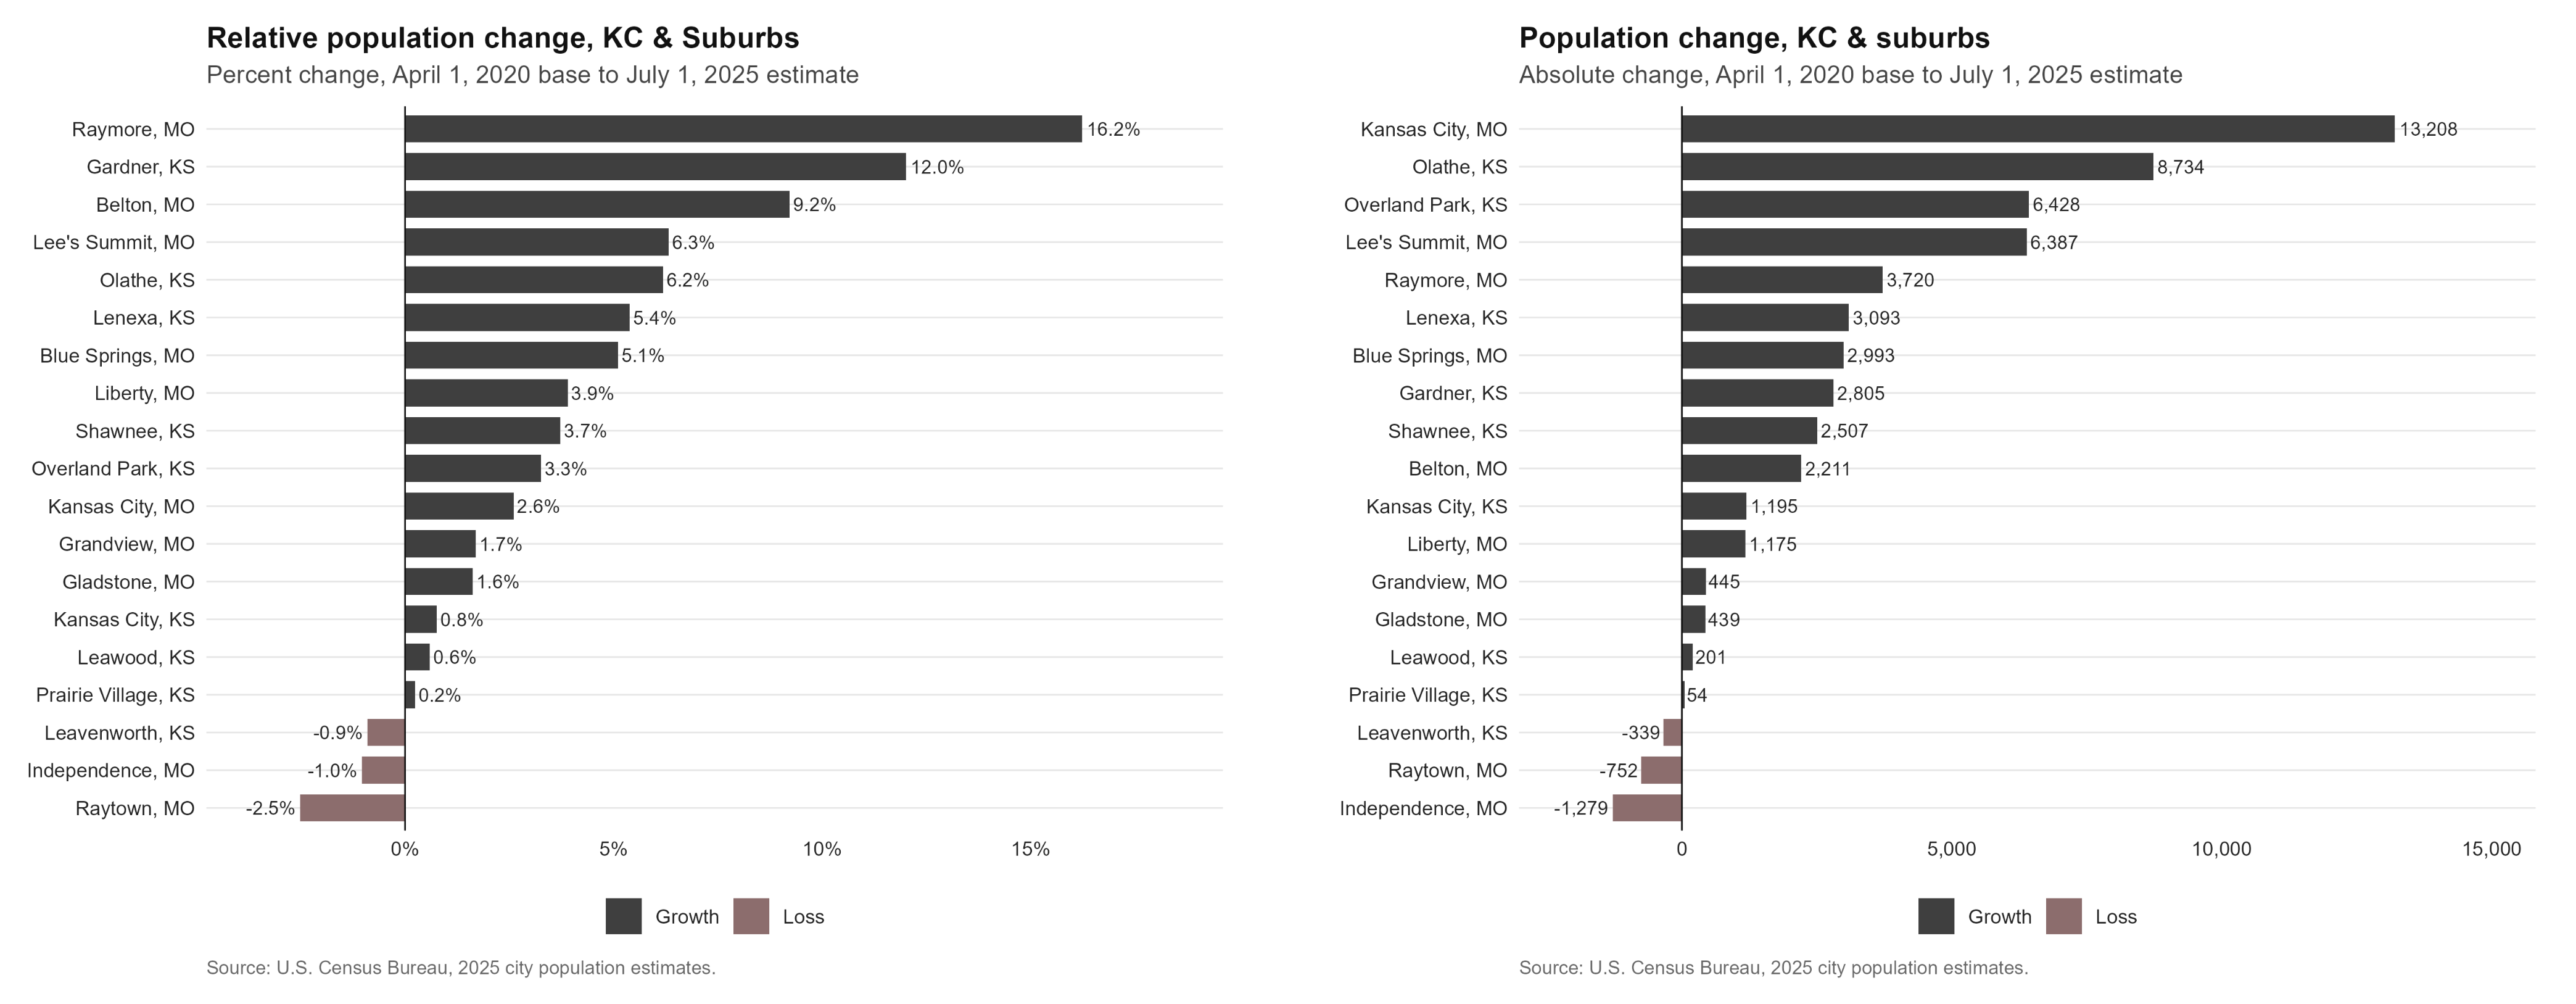
Quick Hit #4: KC is adding more residents than any of its suburbs. But they’re growing faster.
The largest gains since 2020 have been in KCMO, Olathe, Overland Park, Lees Summit…and Raymore, which is the fastest growing locality in the metro. Raymore, Gardner, and Belton, all growing from a small base, lead the metro in relative growth. In relative terms KC falls all the way from first to eleventh and Overland Park falls from 3rd to 10th.
On the other end of the spectrum, Raytown leads in relative decline, while Indendence leads in absolute decline after losing more than twelve hundred residents in five years. Population decline in these two cities (and on the east side of KCMO) is one of JaCo’s two most serious medium-term problems.
Most of the fast-growing small cities are adding single-family housing overwhelmingly, while the larger (including KC, OP, Lenexa, Olathe, Lees Summit) are more mixed. Overland Park has permitted at least 1,500 apartments in large buildings since 2020. Lees Summit permitted more than 2,200, including more than 1,100 last year.
Close1
Population growth is among Kansas City’s biggest challenges over the next few decades. Improving amenities (the streetcar being the headliner) and the pull of centrality have drawn people into the core over the past decade and a half, but any number of challenges (violent crime being the headliner) could start to slow or reverse gains. Even if the Northland and the streetcar spine (Riverfront→Plaza) keep growing, further decline east of Troost could offset gains and leave the city with deepened fiscal liabilities that will be especially challenging if its post-covid downtown employment base remains weak.
With that said, it’s hard to feel too pessimistic about a year where the city added 4,700 new residents. That’s 4,700 more people renting apartments, shopping in local stores, paying the income tax, and enlivening our parks, sidewalks, and events. Growth is positive sum. I’m happy to have it here.
I didn’t compare these figures to MARC’s 2050 population projection here, mostly because I haven’t dug into their latest (2024) update and think this decade has been and will continue to be too up-and-down to get a meaningful sense of how what we’re seeing will shake out in a quarter century. But from a quick glance it looks like we’re above the line.